
I've wanted this for a while: a model I own, on a box I own, doing real work for my agents and my apps without a meter running in the background.
As of this week, I've got it. Tencent's HY4 Flash runs on a single AMD Strix Halo in my homelab, inside Gufo, an inference runtime I wrote in Rust. Getting there took a C++ codebase that lied to me about its own health, a preview model with weird habits, and an AI coding agent that decided attention should run on the CPU.
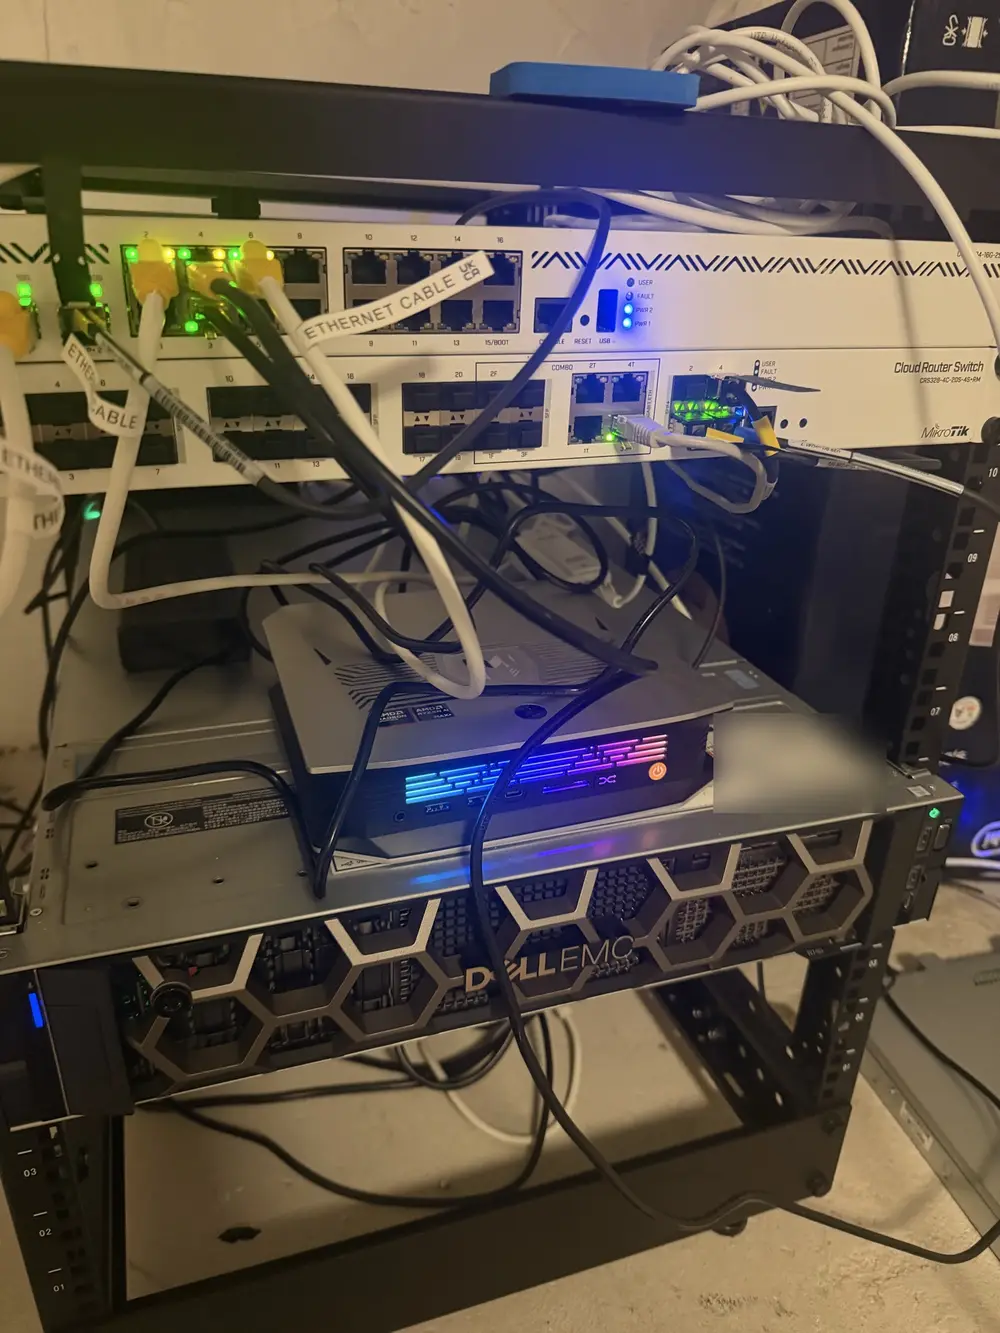
Here it is. Apologies for my ugly-ass homelab. The ugly box that looks like a gaming router from 2014 is the Strix Halo.
I'm not going to oversell it. HY4 Flash isn't a frontier model. It's about Luna or Haiku level, and it won't out-think the big labs' best.
I don't need it to. What I wanted was ownership. I can poke at every layer of it, and I get close to unlimited inference. Single-stream speed is nothing to write home about, for prompt processing or decode. But I mostly throw async background jobs and lots of concurrent sessions at it, and there the total throughput is decent. It's my workhorse, not my racehorse.
It also doesn't change under me. No surprise version bump, no new pricing page, no new tuning that breaks prompts I spent a week on.
I've been banging this drum for a long time: the AMD Strix Halo is massively underrated next to NVIDIA's DGX Spark.
The Spark costs about 2.5 times as much for the same amount of memory. And the "lower performance" people report from their Strix Halos usually isn't the hardware. It's the software. Most people run it through general-purpose runtimes like llama.cpp, which leave a lot of this chip on the table, compare the result with NVIDIA's far more polished stack, and decide the AMD box is slow.
To be fair to NVIDIA: on raw compute, the Spark is the more powerful machine. It has a lot more FLOPS. But memory bandwidth is roughly the same on both, and decoding a big model is mostly limited by bandwidth, not FLOPS. My bet is that hyper-optimised kernels, plus a few optional, slightly lossy tricks, can make up most of the difference against a Spark running generic software like vLLM.
That bet is the real reason Gufo exists, with its own HIP kernels. I think this hardware is badly underused, and the only way I could prove it was to write the software myself.
There's a boring practical reason too. The Strix Halo is a normal x86 machine with Zen 5 cores, so it runs Proxmox and whatever containers I like without any fuss. You can probably get Proxmox going on an ARM box like the Spark, but I doubt it's as smooth, and I wanted a mixed-use box. More on that further down.
The Strix Halo has 128 GB of unified memory, shared by the CPU and GPU. HY4 Flash at Q4_K_M is about 101 GB of weights. That doesn't leave much room for luxuries like KV cache, or an operating system.
To claw some back, we're moving the model's n-gram tables out of GPU memory onto a fast scratch drive and reading entries on demand. That frees a decent chunk for KV cache and more sessions.
The architecture doesn't make life easy either: 512 experts with 16 picked per token, compressed MLA attention, sparse attention, sliding windows, the n-gram tables, and a head that predicts several tokens ahead. Each of those needs its own kernels, and almost nothing off the shelf runs them well on this chip. So I built my own runtime.
Gufo started life as an open-source C++ inference project. I spent most of the last couple of months on my own fork of it, then rewrote the lot in Rust. It only shares the name now. It's a different upstream, and pretty much nothing of the original survives.
| When | What |
|---|---|
| Previous months | My C++ fork, serving Qwen3.8 Flash-Next on the same box |
| 16 November | Production moves to the Rust engine; the C++ build stays as a rollback |
| 19 November | I start a spike comparing HY4 Flash with Qwen on time per task |
| 20 November | The prefill fix lands and the HY4 release is ready for cutover |
| 22 November | HY4 passes the end-to-end agent tests with pi and Codex |
On 14 November my box got OOM-killed. Later that day it crashed again during a model reload, for variety. I went looking for the cause and the C++ had nothing to tell me. Reading the code explained why:
catch (...) blocks threw them away. Streaming clients got "generation failed" and nothing else. HIP errors were squashed into a bool or ignored, and one vendored kernel just called abort()./health always said OK. /ready only checked that a model had loaded at some point in history, so a dead engine could happily report ready.That was the day I called it: a full Rust rewrite, aimed at stability and observability. The speed lives in the HIP kernels, so those stayed and everything around them went.
Some of the fixes are just better design: one process per model under a supervisor, a readiness check that actually checks, a cache that doesn't delete things in a panic. Rust does the rest of the heavy lifting, which is why I've been banging on about Rust for agent-written code. Errors are values you have to deal with, so the cause makes it into the log. Every allocation is charged to an owner before it happens, so missing memory is a metric with an alert on it rather than a mystery. And a lot of memory bugs simply don't compile.
The Rust worker sits at about 0.5–1.1 GiB of host RAM. The C++ one's alert threshold was 11 GiB, and it needed it.
Running a 101 GB model on a mini PC means living right at the edge of heat and memory. I found both edges.
Heat. On 27 September a long-context benchmark, with the GPU pinned to its top clock and pulling 173–191 W, hit 109 °C against a 110 °C trip, and the box switched itself off with no warning. The board (a Bosgame AXB35-02) gives Linux no fan control at all, so I built and signed a community EC driver for it and set the fan curves much more aggressively. Gufo now sheds side models from 90 °C and unloads everything non-critical at 95 °C. I'm also considering a power cap below 150 W. Decode is bandwidth-bound, so I'd bet it costs less speed than it saves in heat, but I haven't measured it yet.
Memory. On 14 November the GPU's share of RAM wasn't counted against the container's limit, so the limits added up to about 133 GiB on a 124 GiB box, and the host OOM-killed the engine. It came back failing every request while reporting healthy. The eventual reload's 78 GiB of reads then hung the NVMe controller, panicked the kernel and kept the box down for about 80 minutes until I power-cycled it by hand. The fix was caps that actually add up, gentler reloads, and mostly the Rust runtime's budgets: every allocation, GPU memory included, is charged to an owner before it happens. The C++ build had no idea how much memory it was using. The Rust one can't allocate without knowing.
Before HY4, my box ran Qwen3.8 Flash-Next. I like that model a lot. But it's a preview, trained to show off Qwen4 Flash, which still isn't out as I write this.
Previews come with preview habits. It thinks for a long time, burns reasoning tokens like they're free (they were, but still), and takes ages to actually finish things. It also does odd little things I can forgive in a demo but not in a SaaS backend, where a paying customer gets the weird answer.
People kept telling me HY4 Flash was much faster per task, so I ran a spike to check. They were right, and HY4 got the box.
Getting a model to chat is the easy bit. I wanted one my agents could drive for an hour without fumbling a tool call, and that's where most of the non-kernel work went:
Then I pointed my real clients at it and counted:
| Client | Tool calls | Time to first token (p50) | Prompt-cache hit |
|---|---|---|---|
| pi | 16/16 | 0.82 s | 97% |
| Codex | 13/13 | 0.77 s | 99% |
No errors. Cancelling a request frees its session in 33–107 ms, which matters because agents cancel constantly.
My favourite bug of the whole project. The model gave slightly different answers depending on how a prompt was split on the way in. Same text, whole or in two pieces, different output.
Every kernel passed its tests. The catch was that different prompt sizes took different code paths, and each path rounded very slightly differently. Normally nobody would notice. A 512-expert router notices: a last-bit difference flips which experts get picked, and from there the answer really is different.
The fix was to push every prompt through the same arithmetic however it's cut. Small prompt pieces got slower, and I didn't lose sleep over it. An agent that behaves differently depending on what's in the cache produces bugs nobody can ever reproduce, and I'd much rather have slow than haunted.
I didn't write Gufo by hand. Several AI agents worked on it in parallel, one coordinating the others, with a reviewer from a different model family checking work before it merged. I've written about that council setup before. Some of it went well. Some of it did not.
One GPU for everything. Benchmarks, tests and the live service all queue for the same chip. Run a compile next to a benchmark and decode looks slower, because they're fighting over memory bandwidth, and nothing tells you. I found that one out the fun way.
CI and merges. Two CI runners don't go far with several agents opening PRs at once, and every merge forces every other open PR to rebase. For a while I was basically a merge queue with a pulse.
Then there's GPT-6.2 Astra. I ran it on high, x-high and max reasoning. It was unusable at all three.
Its signature move is the one that makes anyone who's written GPU code wince: shuttling data between the CPU and GPU. It moved the matrix multiplies onto HIP, which is good, and left attention running in Rust on the CPU, which is not. After every GPU projection the result came back to the host, the CPU did the scores, softmax and value sums, and the GPU sat there waiting for it.
When I asked it why on earth any work was happening on the CPU at all, it was refreshingly honest:
"Because I put GPU kernels underneath a CPU-driven reference implementation and optimized the kernels before fixing that design."
The numbers were spectacular in the wrong direction:
"One 45-token request issued 82,039 copies, each followed by a wait."
A later trace still sent 867 MB back to the CPU for a 45-token prompt and eight output tokens. It hit 103.65 seconds to first text on a 512-token prompt. llama.cpp did the same prompt in 3.37 seconds. And the two outputs diverged at byte 4.
Its own diagnosis was hard to argue with:
"The mistake was treating 'the worker uses HIP' as evidence that the whole forward pass was GPU-resident."
My messages to it got shorter as the day went on. "you're clearly doing something fundamentally wrong." "completely rip all that out. it should be fully inside the GPU." "rust is literally just the orchestration/application layer." At one point it took my production service down while doing all this.
The best bit was overnight. I went to bed asking it to have something to show me by morning and to make me proud. I woke up to:
"On that retrieval, width128 cut time to first text from 34m 25s to 30m 50s. Qwen is still the production model."
Thirty minutes to first text, down from thirty-four. Not the morning I'd hoped for.
Opus 5.5 was a different world. On high and x-high it was ridiculously good at kernel optimisation. It ported and optimised Qwen Flash-Next in an afternoon, the same job Astra was still trickling tokens out of the next morning.
As a recent Claude convert: Opus 5.5 is a game changer.
I think it's one of the biggest step changes in a model release I've seen. It understands where the data lives and why moving it is expensive, which is the whole game on a GPU.
The lesson I keep relearning: agents make kernels and plumbing cheap to write, and the model you pick matters more than the prompt you give it. You still have to understand the hardware well enough to spot when something is very confidently running on the wrong chip.
Once it was correct, I started hill climbing: change one thing, measure, keep it or bin it, repeat. Most of my ideas lost. That's normal, and it's why I care more about the measuring than the ideas.
Every candidate ran as control, candidate, control: the current build, then the change, then the current build again. If the two controls disagree, something else on the box moved (usually a compile I forgot about) and the run doesn't count. Speed alone wasn't enough either. Each change also got a quality number, the KL divergence from the full model, where zero means identical and bigger means drifting.
My rule out of all this: the default stays as close to the original model as I can keep it, and anything lossy is opt-in, with its measured cost written next to it.
The cheapest wins are in how the weights are stored. Moving the output layer (lm_head) to Q8_0 is effectively free: +3% at one session for a KL of 3e-5, so it's the default. The MTP head gets the same treatment, converted from BF16 to Q8_0 at load.
Then there are the lossy requants: pushing more of the model to coarser formats so less data moves per token. Decode on this box is memory-bandwidth-bound, so fewer bytes means more speed. They're real gains, and so is the drift. I ended up with three profiles at +18%, +28% and +37%, costing KL 0.07, 0.11 and 0.21. None of them is my default.
My favourite experiment. HY4 picks 16 of its 512 experts for every token, and it weights them: the lowest-weighted few contribute the least to the output. Fast mode only runs the top 12, or the top 10, and skips the rest. Fewer experts means fewer weights read, which on a bandwidth-bound box is the whole cost.
It works: +5–14% with 12 experts and +9–22% with 10, depending on how many sessions are running. But it's the model doing less work per token, so it's opt-in, with its cost listed like everything else.
Speculative decoding drafts a few tokens cheaply and has the full model check them in one pass. I tried chained drafts from the model's own MTP head, prompt lookup (copying likely continuations from the prompt, which is great for code edits) and a planner choosing between them. With one session that's +38%, and +77% for greedy decoding. With four or more sessions it does nothing, because the GPU is already busy and there's nowhere for the extra drafts to go.
| Option | Speed-up | Quality cost | Default? |
|---|---|---|---|
| Higher-precision output layer | +3% (1 session) | KL 3e-5 | Yes |
| Sampling on the GPU | +7% | n/a | n/a |
| Quant profiles | +18% / +28% / +37% (1 session) | KL 0.07 / 0.11 / 0.21 | Opt-in |
| Fast mode, 12 of 16 experts | +5–14%, by concurrency | lossy | Opt-in |
| Fast mode, 10 of 16 experts | +9–22%, by concurrency | lossy | Opt-in |
| Speculative decoding | +38% (1 session), +77% greedy; flat at 4+ | n/a | Opt-in |
| Compressed KV for long context | two ~290K prompts, 6/6 needles found | first token: 593 s | Opt-in |
The free wins are small and the big ones all cost something. Long context genuinely works, but ten minutes to the first token is long enough to make a coffee and drink it, so it isn't a default.
So, was writing my own runtime worth it? Here's my device engine against upstream llama.cpp on the same box, the same Q4_K_M weights, over HTTP, with no prompt caching unless stated. These are from 21 November, before some of the later hill climbing.
| Test | llama.cpp | Gufo |
|---|---|---|
| 512-token prompt → first text | 2.52 s | 1.22–1.32 s |
| Decode, 1 session | 4.3–7.0 tok/s | 16.5–17.5 tok/s plain, 20.8–21.9 with MTP |
| Decode, 4 sessions combined | n/a (1 slot) | 43–48 tok/s |
| 11K-token prompt → first text | 53 s | 26.5 s |
| Follow-up turn | re-reads the whole prompt | reads only the new tail |
That's roughly 3× the single-stream decode, twice as fast to the first token, and four sessions where llama.cpp ran one. Same chip, same weights. Correctness holds up too: on teacher-forced top-1 agreement with llama.cpp over four prompts of 32 positions, Gufo matches 125–126 of 128, and every miss is a near-tie between the top two tokens.
This is the point I keep making about AMD. The hardware is good, often as good as NVIDIA's for a fraction of the price, and the software has been letting it down for years. People benchmark a general-purpose runtime on a Strix Halo, see mediocre numbers, and blame the chip. Most of the gap is software, and software can be fixed.
George Hotz said the same thing back in 2023, when he started the tiny corp with the goal "to commoditize the petaflop". About AMD's chips: "This is the best FLOPS per dollar today, and yet…nobody in ML uses it." And the reason: "The software is terrible!" Then: "The hardware is great. We are going to write our own software." That's more or less what I did with Gufo, and I share his worry that "we risk large entities controlling the majority of the compute in the world."
Anthropic thinks so too. It said in its investor presentation this month that Claude Mythos Preview brought up prompt processing for one of its models on AMD MI355X GPUs, at a useful level of performance, in about three days. It wrote or ported almost all of the kernels itself. Anthropic's usual estimate for onboarding new silicon is six to twelve months. If AI can write the kernels, NVIDIA's biggest moat, CUDA and the decade of software built on it, starts looking a lot shallower.
My part of that is small: one box, one runtime, a lot of HIP. But I'm doing everything I reasonably can to help break the CUDA monopoly, and this post is part of it. If AMD hardware runs this well in my homelab for £2,000, the excuse that only NVIDIA can do serious inference gets harder to make.
HY4 is the headline, but it isn't alone in there. The same runtime serves an embedding model, a small decision model and a media-understanding model at the same time, side by side with the workhorse.
The embeddings run on the chip's NPU, which otherwise sits around doing nothing, so they don't take anything from the GPU. The smaller models squeeze into whatever memory HY4 leaves, and media files get decoded in sandboxed workers, so a dodgy upload can only crash its own sandbox. Each model gets its own process and its own memory budget, which is the "one crash took everything" lesson from the C++ days put to use.
Lots of slow jobs at once, with nobody waiting on any particular one, turns out to be most of what I need a model for:
Failover runs through Cloudflare AI Gateway. If Gufo can't serve a call, it falls through to the same model, HY4 Flash, hosted on Tencent Cloud.
This box serves customer-facing apps right now, which is exactly why I set up the failover. Those apps process public information, not private customer data, and what gets processed where is disclosed. Failover traffic does go to a third party, which isn't my favourite thing, but it's an easy trade for that kind of data.
I want the same model on the other end because I tune my prompts against the model, sometimes recursively, with a model rewriting and scoring prompts over many rounds. Those prompts are fitted to one model's quirks. Fail over to a different model and they start behaving differently at exactly the moment something has already gone wrong. Same model on both ends, and a failover is boring, which is what you want from a failover.
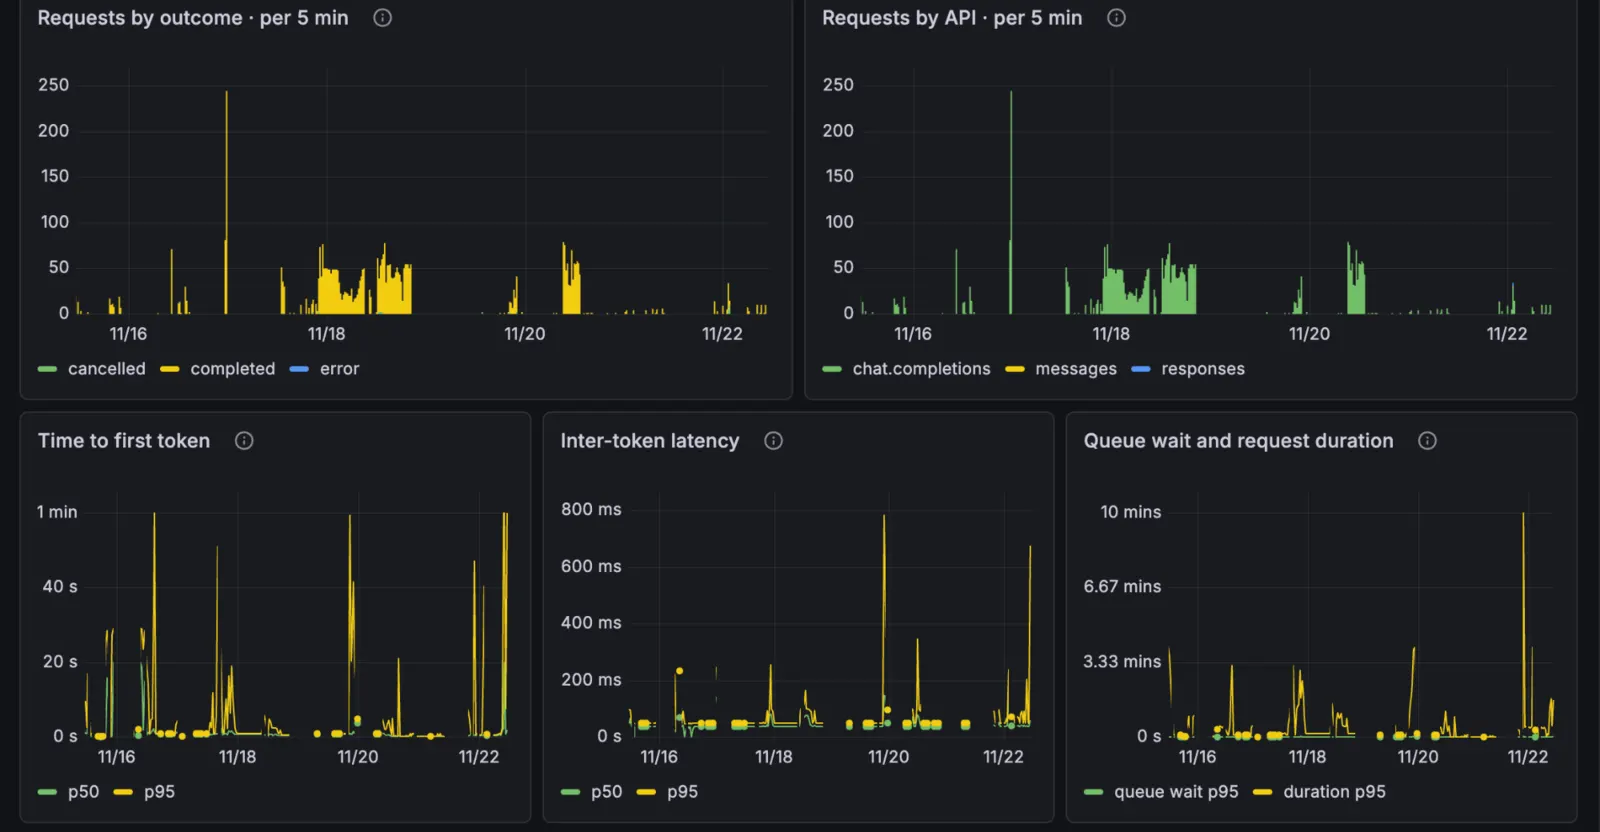
Naturally I built a Grafana dashboard. Here's the box over the last week: GPU busy, memory, temperature and power. You can see exactly when my agents were hammering it, and when I was asleep.
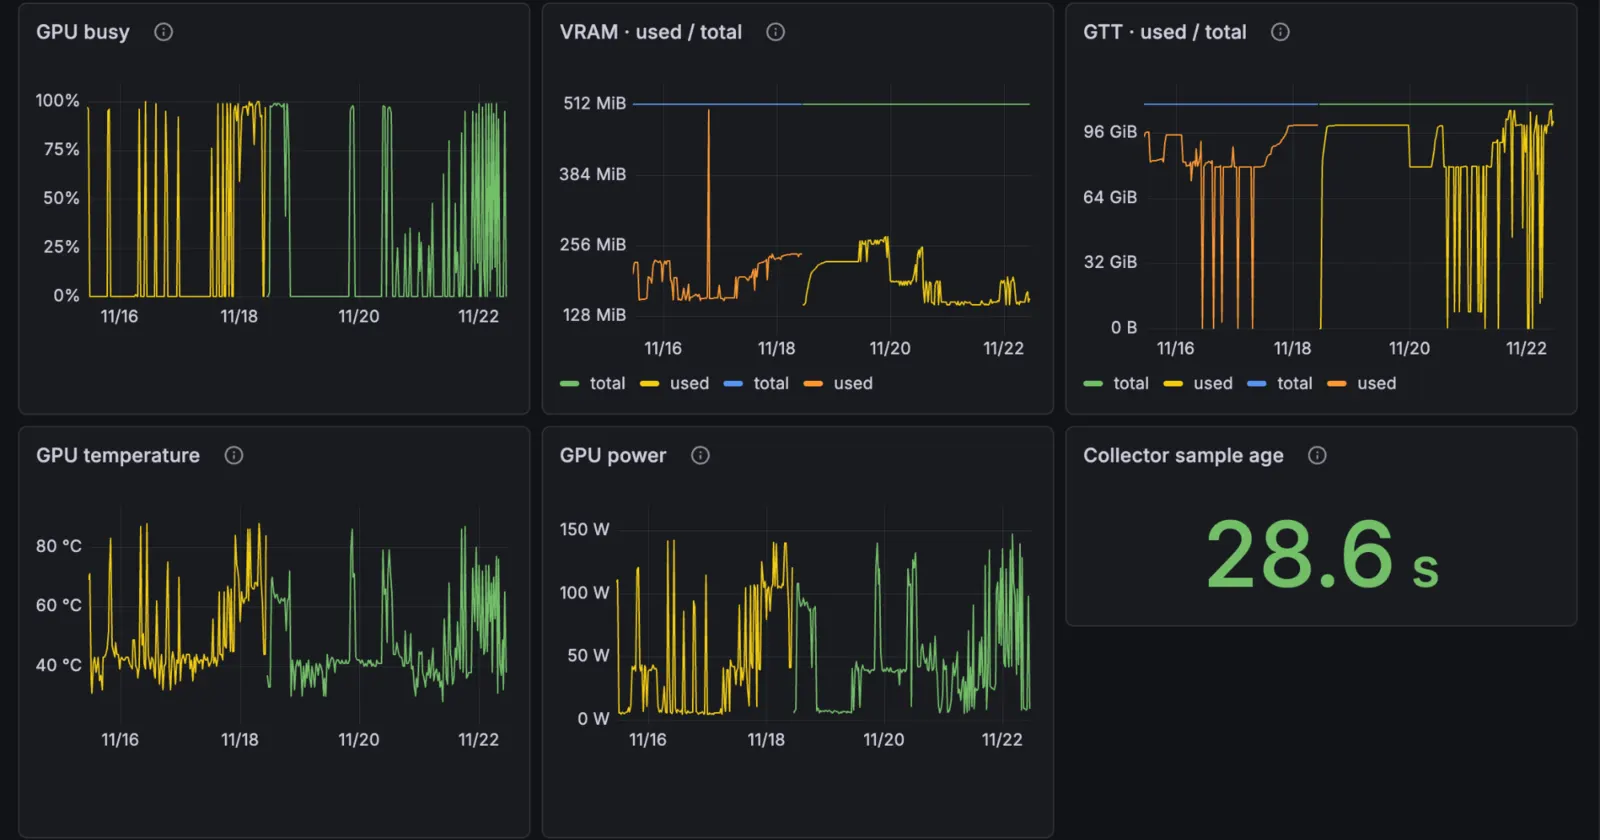
Over the last 30 days, which in practice means the two weeks it's been doing real work, it has processed about 1.94 billion prompt tokens and generated 6.82 million, across 30.7K API requests. Most of those prompt tokens never touched a kernel: the prefix cache hit rate is 91.6%. Agents resend the same long context over and over, so caching it is most of the game.
The panel I check most is COGS saved. Every text call from my apps records its provider, its input and output tokens, what it actually cost, and what it would have cost on Haiku at list price. On Gufo the actual cost is zero, and the difference is the saving. Prompts and responses aren't logged, only the counts.
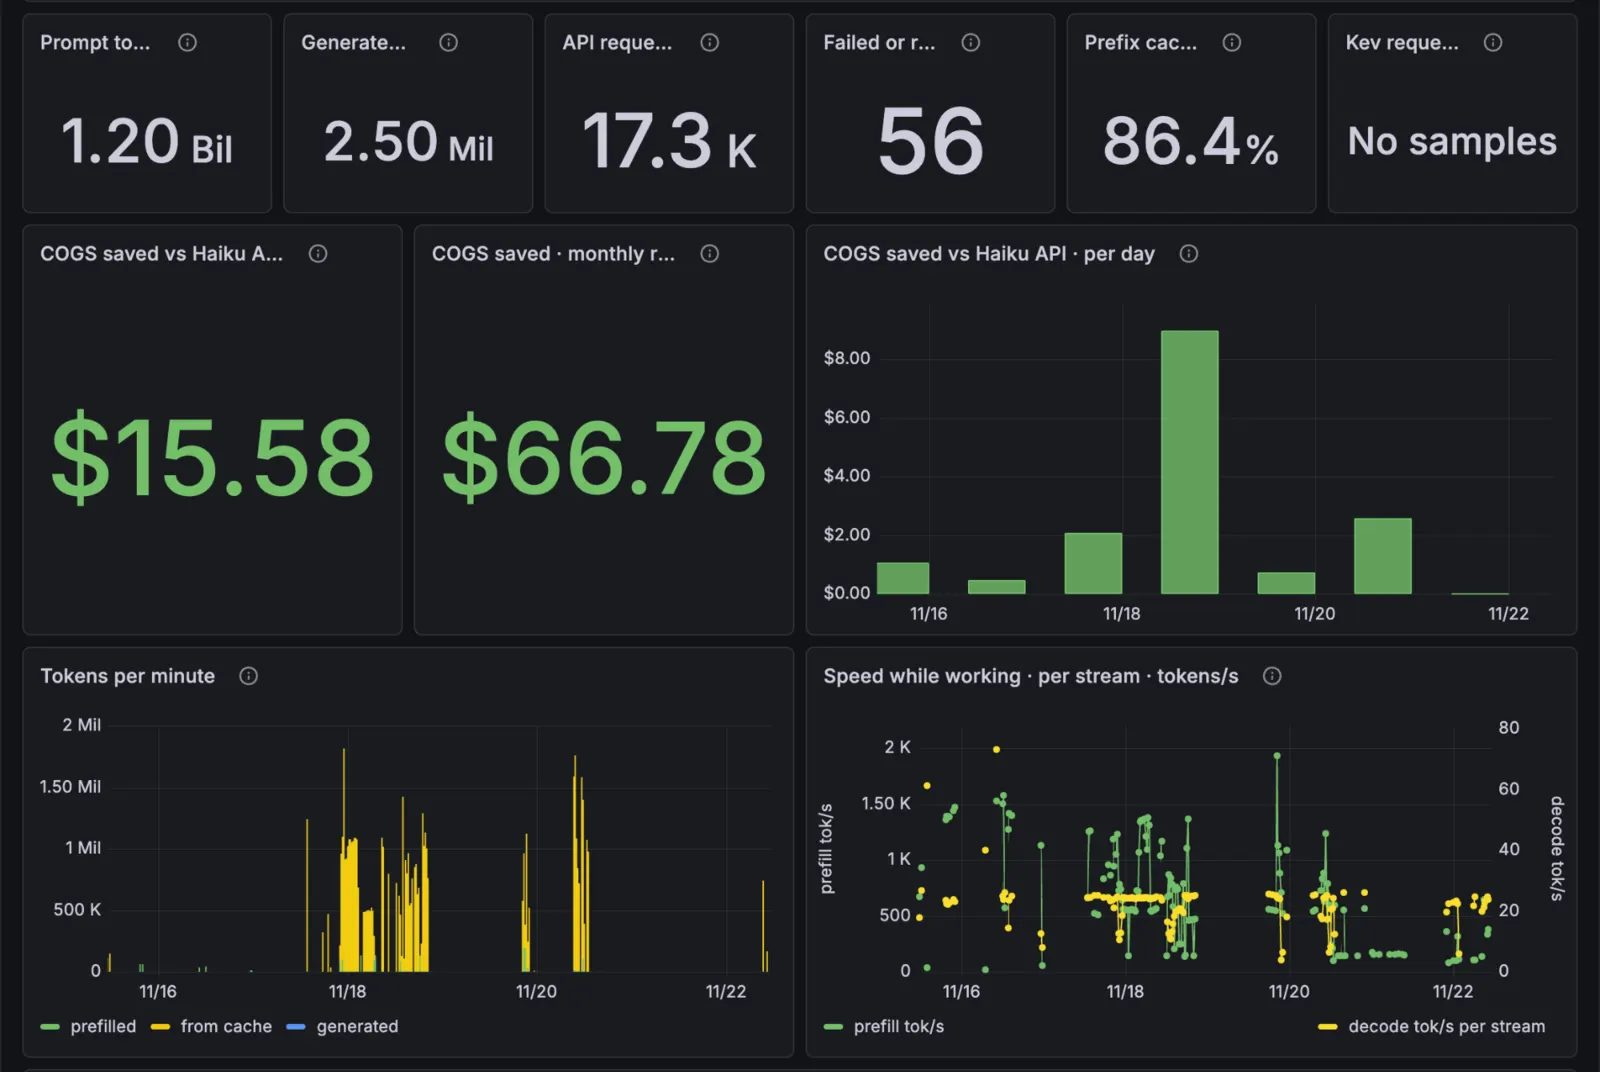
Over the last week that's $15.58 saved against the Haiku API, a run rate of about $66.78 a month. That won't buy me a yacht, and it'll grow as more of my apps move over.
The latency side is less flattering, and I'm leaving it in. Time to first token is usually fine, with p95 spikes up to a minute when long prompts queue behind each other. That's the price of one GPU and a lot of patient jobs.
Honestly, the COGS number isn't the point. The Strix Halo cost me £2,000, and the AI savings alone would take a few years to pay that back. But it was never only an AI box.
It runs Proxmox. HY4 takes the biggest slice by a mile, and everything else lives in the RAM that's left over:
This is the bit the DGX Spark comparison usually misses. It's a normal x86 box with Zen 5 cores, so it behaves like any other Proxmox host. AI serving is its main job, and the COGS saved is a nice number. The real value to me is one quiet box doing my inference, my media and my experiments all at once.
The GPU spends a lot of the day doing nothing, which personally offends me. My plan is to use that time to fine-tune a small LoRA adapter for the pi harness inside the runtime, on the weights it's already holding for serving. No second copy of a 101 GB model, no second machine.
From what I've read, the gains come from training on verified runs of tasks that can be executed and checked, not raw agent logs. A log tells you what the agent did. A verified run tells you what worked.
I've set the promotion bar before any training starts:
If an adapter doesn't clear that, it doesn't ship, however nice the demo looks. I learned that one the hard way last time.
What I want in the end is a box that does my agents' work during the day and studies it overnight. I'll write that one up when it works.